
Spark Monitoring & Debugging 101: Monitor Your Jobs with Spark Logs and UI
If you’ve ever watched a Spark job mysteriously slow down, disappear, or throw cryptic errors at 3 a.m., you already know: monitoring and debugging are survival skills for any Spark developer or data engineer.
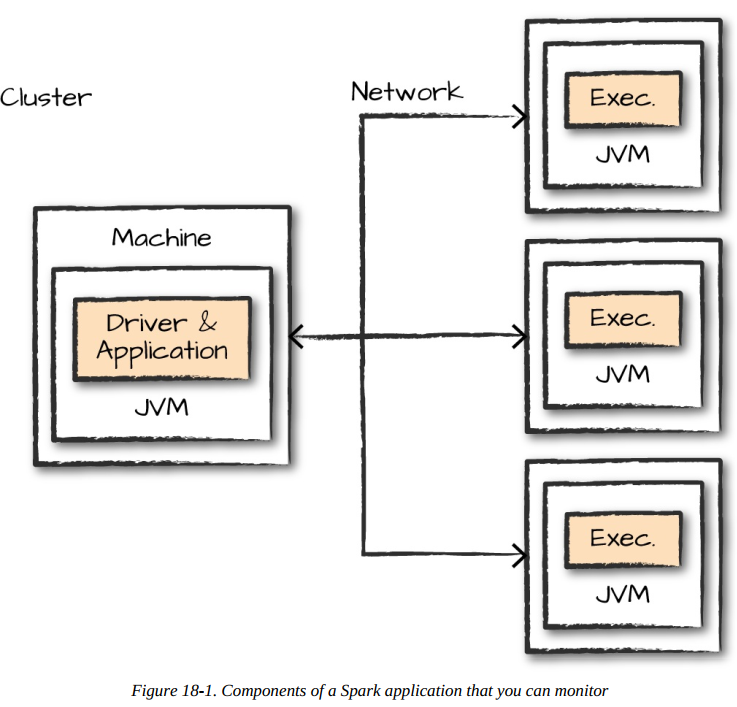
What components are involved in monitoring?
Spark Applications & Jobs (Start Here!)
Your very first stop should always be the Spark UI and Spark logs. These tools show you exactly what Spark itself sees: running applications, jobs, stages, tasks, RDDs/DataFrames, shuffled data, cached partitions, and physical query plans.
→ 90% of day-to-day performance questions and bugs are solved right here.
JVM Level (When Spark UI Isn’t Enough)
Spark executors (and the driver) run inside Java Virtual Machines. If tasks are slow because of garbage collection pauses, excessive memory usage, or thread deadlocks, you need to look inside the JVMs.
Handy built-in Java tools the book recommends:
jstack – print thread stacks (great for deadlocks)
jmap – generate heap dumps
jstat – live GC and memory statistics
jconsole or jvisualvm – visual JVM explorer and basic profiler
The Spark UI already shows GC time per task, but when you need the deepest insight, these classic JVM tools are still unbeatable.
Operating System / Machine Level
Your JVMs don’t run in a vacuum—they live on real servers. If the machine is starved for CPU, swapping like crazy, or the network/disks are saturated, Spark will suffer no matter how perfect your code is.
Key things to watch: CPU usage & load, Memory/swap, Disk I/O (reads/writes), Network throughput and errors
Quick Linux tools the authors love: dstat – all-in-one system view, iostat – disk stats, iotop – who’s hammering the disk right now
Cluster Level (The Big Picture)
Finally, zoom all the way out to the cluster manager itself:
YARN → ResourceManager UI
Kubernetes → dashboard or metrics-server
Standalone → master web UI
Mesos → framework view
If nodes are down, containers are getting killed, or the cluster is out of resources, no amount of Spark tuning will save you.
Popular cluster-wide monitoring stacks are: Ganglia (classic), Prometheus + Grafana (modern standard), Cloud-provider tools (CloudWatch, Azure Monitor, GCP Operations, etc.)
Bottom Line – Where to Start?
Always begin with the Spark UI + logs → move to JVM tools → check the host OS → finally look at the cluster manager. That exact order will solve almost every production firefight you’ll ever face.
What exactly to monitor though?
When monitoring Spark applications, the book emphasizes that you need to track six core categories at different levels of the execution hierarchy. These aren't just nice-to-haves—they're the exact metrics that reveal why your jobs are slow, failing, or wasting resources. Here's the full breakdown straight from the chapter:
First and most importantly, monitor your Spark applications and jobs. This is the highest-level view and where you'll spend 80% of your time. Track the status of all running jobs (succeeded, running, failed), the stages within each job, and the overall DAG visualization. Pay special attention to job durations, stage completion times, and any skipped stages or skipped tasks. The book stresses watching for stage skew where one stage takes dramatically longer than others, which often indicates data skew, inefficient partitioning, or shuffle bottlenecks. Also monitor the SparkContext status and any active streaming receivers if you're running Spark Streaming.
Next, dive into tasks and executors. At the executor level, you need visibility into active executors, dead executors, removed executors (due to failures or dynamic allocation), and executor memory usage. The chapter explains that executor monitoring reveals resource starvation—when executors are constantly being killed due to OOM or heartbeat timeouts, it's usually insufficient memory or too many tasks per executor. For individual tasks, track task duration, GC time, shuffle read bytes, shuffle write bytes, disk spill amounts, and peak execution memory. High GC time relative to task time (anything over 10-20%) is a massive red flag for memory pressure, while excessive shuffle read from disk (rather than memory) indicates spills from over-aggressive caching or insufficient executor memory.
Storage and caching metrics are critical for memory-intensive workloads. Monitor which RDDs and DataFrames are cached, their memory and disk usage, the fraction cached (how much data is actually in memory vs. spilled), and cache hit ratios. The book points out that if you're caching partitions but seeing low cache hit ratios or immediate evictions, your cluster is memory-constrained and you need to either increase executor memory, reduce caching, or tune the spark.memory.fraction settings.
Shuffles deserve their own dedicated monitoring. Shuffles are Spark's biggest performance killer, so track shuffle read and write bytes across all stages, shuffle spill amounts, and shuffle fetch wait times. The chapter specifically calls out monitoring the external shuffle service if you're using dynamic allocation—without it, you can't safely scale executors up and down mid-job. Watch for stages where shuffle write is disproportionately high compared to input size, which indicates expensive operations like groupBy or join on skewed data.
Don't neglect the driver. The driver's health affects everything—monitor driver memory usage, active threads, and any driver GC pauses. If the driver GCs heavily, it delays task scheduling and heartbeat processing, causing executor timeouts even when executors are healthy.
Finally, track environment and configuration. Verify that your spark-submit parameters, spark-defaults.conf settings, and runtime properties actually took effect. The Environment tab in Spark UI shows you exactly what Spark thinks its configuration is—mismatches here explain 90% of "but I set spark.executor.memory to 8g!" problems.
This is a guide to monitor which is complete diagnostic hierarchy: application/job → stages → tasks/executors → storage/shuffles → driver/environment. When something breaks, you systematically drill down through these layers rather than guessing. Most importantly, it warns against monitoring everything—focus on these six categories first, as they reveal 95% of production issues.
This targeted approach means you're not drowning in Grafana dashboards but actually solving real Spark problems.
Spark Logs
One of the richest and most under-used monitoring tools in Spark is its own log files. When a job fails silently, throws confusing exceptions, or just behaves strangely, the driver and executor logs almost always contain the exact clue you need — stack traces, shuffle errors, OOM messages, heartbeat timeouts, or even your own custom debug messages.
Logs become infinitely more powerful when your application logs live side-by-side with Spark’s internal logs. If you use the official application template that comes with the book (Scala/Java), it configures Log4j so your own log.info() or log.warn() statements appear interleaved with Spark’s messages. This makes it trivial to see “my code read the file → Spark scheduled 200 tasks → task 42 failed because of corrupt record” all in one place.
A small caveat for PySpark users: Python can’t directly hook into Spark’s Java-based Log4j system. But don’t worry — anything you print with Python’s built-in logging module or even simple print() statements still goes to stderr and shows up perfectly in the executor logs. You won’t lose visibility.
Controlling Verbosity in Real Time
Want to dial the noise up or down without restarting the job? Just run this one-liner from your driver code (works in Scala, Java, Python, and R):
spark.sparkContext.setLogLevel("INFO") # or "WARN", "ERROR", "DEBUG", "TRACE"
WARN → production default (quiet but useful)
INFO → good for day-to-day debugging
DEBUG → extremely verbose, great when you’re lost
TRACE → rarely needed unless you’re modifying Spark itself
Where Do the Logs Actually Live?
Local mode → Everything is printed straight to your terminal (stdout/stderr)
Cluster mode → The cluster manager decides:
YARN → “Logs” link on the ApplicationMaster page
Kubernetes → kubectl logs <driver-pod> and kubectl logs <executor-pod>
Standalone → $SPARK_HOME/work/<app-id>/<executor-id>/ on each worker node
Databricks, EMR, etc. → their own “Logs” tab
Check your cluster manager’s own documentation — there’s no universal path, but every major manager exposes them through its web UI with one or two clicks.
Why You Should Treat Logs as Historical Artifacts
Live logs are great, but jobs finish (or crash). It is strongly recommended enabling the event log and, separately, persisting the text logs themselves. In production and especially in the cloud, nodes get terminated all the time. If an executor dies and the node disappears ten minutes later, the only copy of its stderr log vanishes with it unless you ship logs somewhere durable (S3, HDFS, CloudWatch Logs, ELK, Splunk, Datadog, etc.).
Even when the answer isn’t immediately obvious from grepping the logs, they narrow the problem dramatically. A cryptic “FetchFailedException” in the logs instantly tells you to look at shuffle issues rather than code bugs. Once you know the rough area, you can add targeted log statements, redeploy, and get crystal-clear context on the next run.
A look into Spark UI
If Spark had a single killer feature that makes veterans 10× faster at debugging and tuning, it’s the Spark Web UI. Open it the second your job starts (default http://driver-host:4040) and never close it!
How to Reach the UI in Every Environment:
Local mode → http://localhost:4040
Cluster mode → – YARN: “Tracking URL” link on the ApplicationMaster – Kubernetes: port-forward the driver pod or use the proxy – Standalone: Master UI → click the application ID – Databricks / EMR / GCP Dataproc: they all give you a direct “Spark UI” button If port 4040 is taken, Spark automatically tries 4041, 4042, etc. After the application ends, the Spark History Server replays the exact same UI from event logs.
These tabs are accessible for each of the things that we’d like to monitor. For the most part, each of these should be self-explanatory:
The Jobs tab refers to Spark jobs.
The Stages tab pertains to individual stages (and their relevant tasks).
The Storage tab includes information and the data that is currently cached in our Spark Application.
The Environment tab contains relevant information about the configurations and current settings of the Spark application.
The SQL tab refers to our Structured API queries (including SQL and DataFrames).
The Executors tab provides detailed information about each executor running our application.

Jobs Tab – The 10,000-Foot View
This is your homepage. Every spark.submit, every count(), every save() becomes a Job. You instantly see:
Job ID, description (e.g., “saveAsParquetFile at …”), start time, duration
Success / Running / Failed status
How many stages each job has and whether any stage failed or was skipped
Total tasks across all stages
Pro tip: Sort by duration descending. The longest jobs are almost always where your money and time are being burned.
Stages Tab – Where the Real Magic (and Pain) Lives
This is the single most visited tab for 99% of performance work. Every job breaks into stages, and every stage breaks into tasks. Key things to check every single time:
Task timeline view (the Gantt chart at the top): One task taking 10× longer than the others = data skew, guaranteed.
Skewed tasks table: Spark literally highlights the slowest tasks in red.
Metrics summary: Median vs. max values for – Duration – GC Time (anything >10–15% of task time is bad) – Shuffle Read / Write (huge max values = skew or spills) – Disk Bytes Spilled (non-zero usually means you need more memory) – Peak Execution Memory
Click any stage → “DAG Visualization” shows the exact physical plan (wide vs narrow transformations).
Click the little “show additional metrics” link and enable Input Size, Shuffle Read Blocked Time, etc. “the fastest way to go from ‘it’s slow’ to ‘here’s exactly why’.”
Storage Tab – Know What’s Eating Your Memory
Lists every cached RDD / DataFrame
Memory fraction vs. disk fraction
Number of partitions cached
Deserialized vs. serialized storage
If you see “Fraction Cached = 10%” on something you explicitly cached, you’re memory-starved — increase executor memory or cache fewer things.
Executors Tab – The Health Report of Your Cluster
Full list: driver + every executor
Active / Dead / Removed (removed = dynamic allocation or speculation kicked them out)
Per-executor: cores, memory used, shuffle read/write, task count, logs links
Stdout / stderr direct links (click them when something weird happens)
Dead executors? Click the reason column — “Lost executor: heartbeat timed out” usually means GC pauses are too long or the network is saturated.
Environment Tab – Stop Guessing What Spark Actually Saw
This tab is pure gold when someone says “but I set spark.sql.shuffle.partitions=5000!” It shows every single property Spark is running with:
Runtime (Spark version, Scala version, Java version)
Spark Properties (from spark-defaults.conf, --conf, setSparkConfig, etc.)
System Properties
Classpath entries
At least 50% of “mysterious” performance differences between local and cluster runs are solved by spotting a missing or overridden property here.
SQL / Structured Streaming Tabs (when applicable)
SQL tab: every DataFrame/Dataset action becomes a query with full physical plan, query duration, and the same stage/task drill-down
Adaptive Query Execution (AQE) details if enabled
Streaming tab: batches, input rows/sec, processing time, trigger details, state store metrics
A Walkthrough with Example
Let’s walk through an example of how you can drill down into a given query. Open a new Spark shell, run the following code, and we will trace its execution through the Spark UI:
spark.read\
.option("header", "true")\.csv("/data/retail-data/all/online-retail-dataset.csv")\
.repartition(2)\
.selectExpr("instr(Description, 'GLASS') >= 1 as is_glass")\
.groupBy("is_glass")\
.count()\
.collect()
This results in three rows of various values. The code kicks off a SQL query.
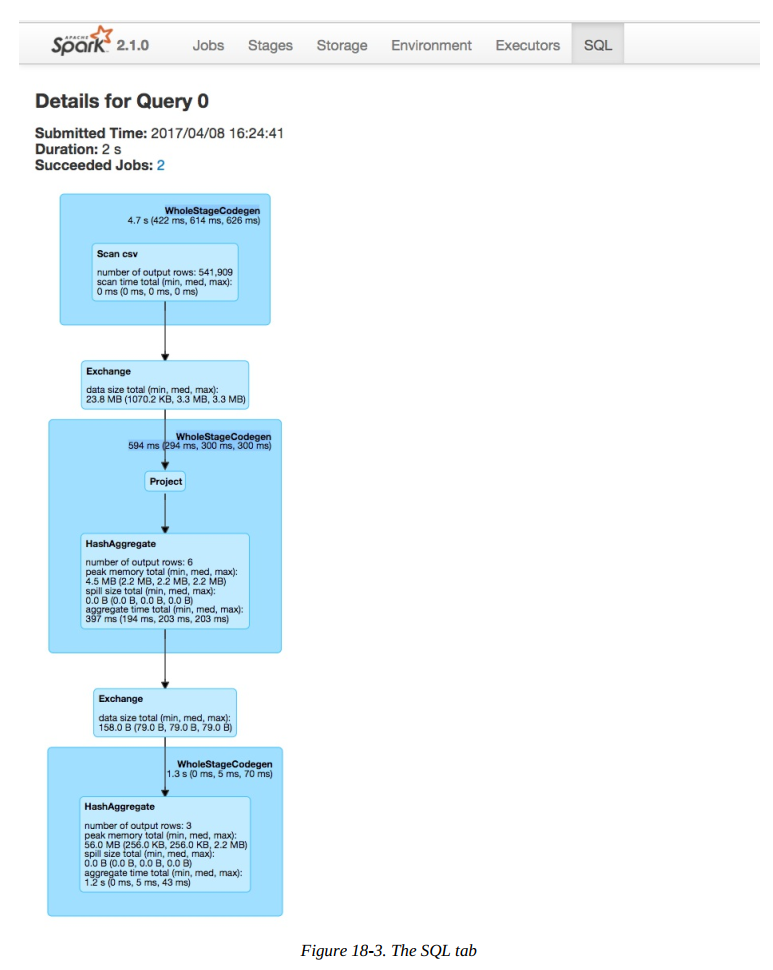
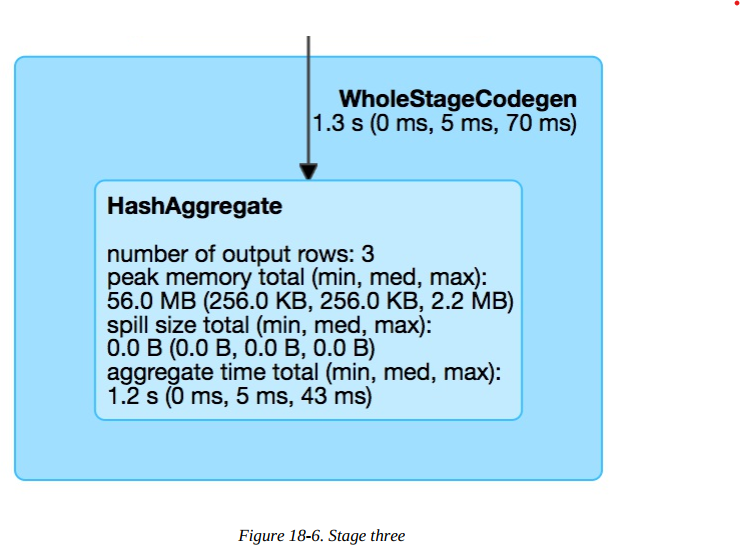
These will become important in a minute, but first let’s take a look at the Directed Acyclic Graph (DAG) of Spark stages. Each blue box in these tabs represent a stage of Spark tasks. The entire group of these stages represent our Spark job. Let’s take a look at each stage in detail so that we can better understand what is going on at each level.
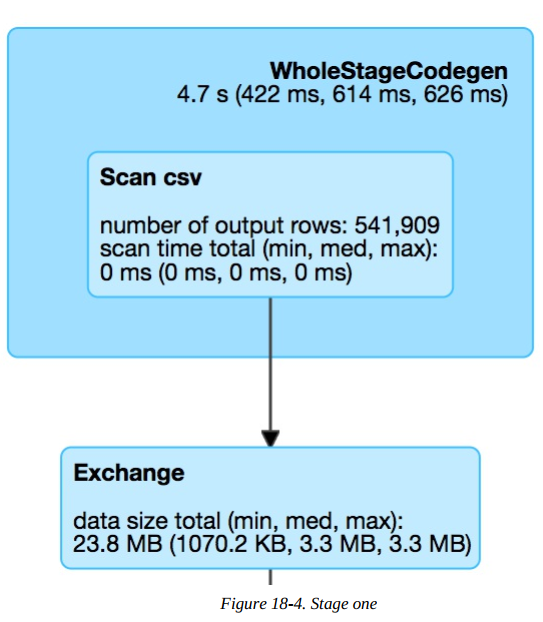
In the above diagram, the box on top, labeled WholeStateCodegen, represents a full scan of the CSV file. The box below that represents a shuffle that we forced when we called repartition. This turned our original dataset (of a yet to be specified number of partitions) into two partitions.
The next step is our projection (selecting/adding/filtering columns) and the aggregation. Notice that in below figure the number of output rows is six. This conveniently lines up with the number of output rows multiplied by the number of partitions at aggregation time. This is because Spark performs an aggregation for each partition (in this case a hash-based aggregation) before shuffling the data around in preparation for the final stage.
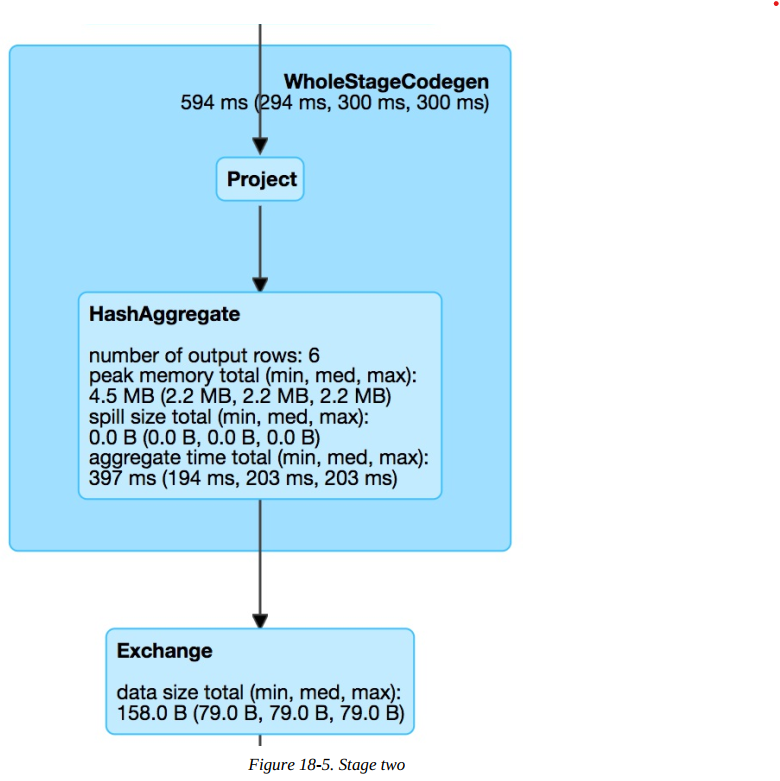
The last stage is the aggregation of the subaggregations that we saw happen on a per-partition basis in the previous stage. We combine those two partitions in the final three rows that are the output of our total query.
Let’s look further into the job’s execution. On the Jobs tab, next to Succeeded Jobs, click 2. As figure below demonstrates, our job breaks down into three stages (which corresponds to what we saw on the SQL tab).
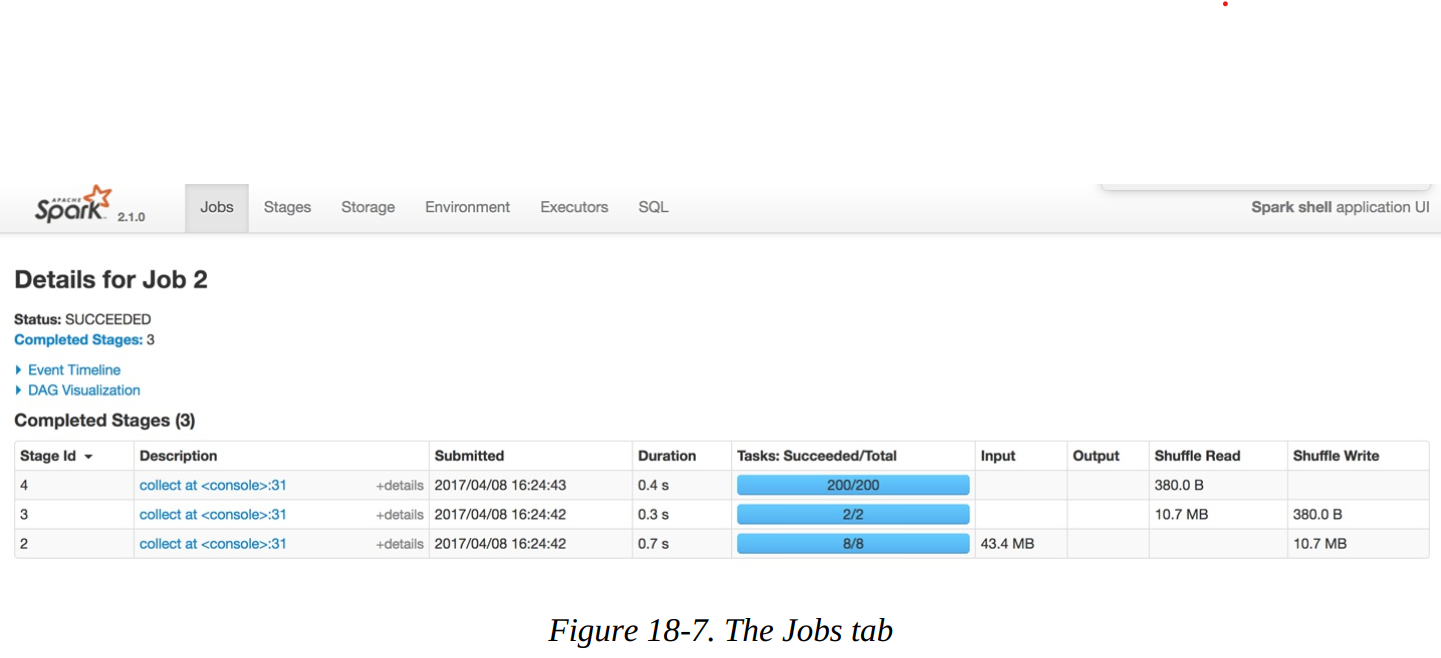
In this example, three stages ran, with eight, two, and then two hundred tasks each. Before diving into the stage detail, let’s review why this is the case. The first stage has eight tasks. CSV files are splittable, and Spark broke up the work to be distributed relatively evenly between the different cores on the machine. This happens at the cluster level and points to an important optimization: how you store your files. The following stage has two tasks because we explicitly called a repartition to move the data into two partitions. The last stage has 200 tasks because the default shuffle partitions value is 200.
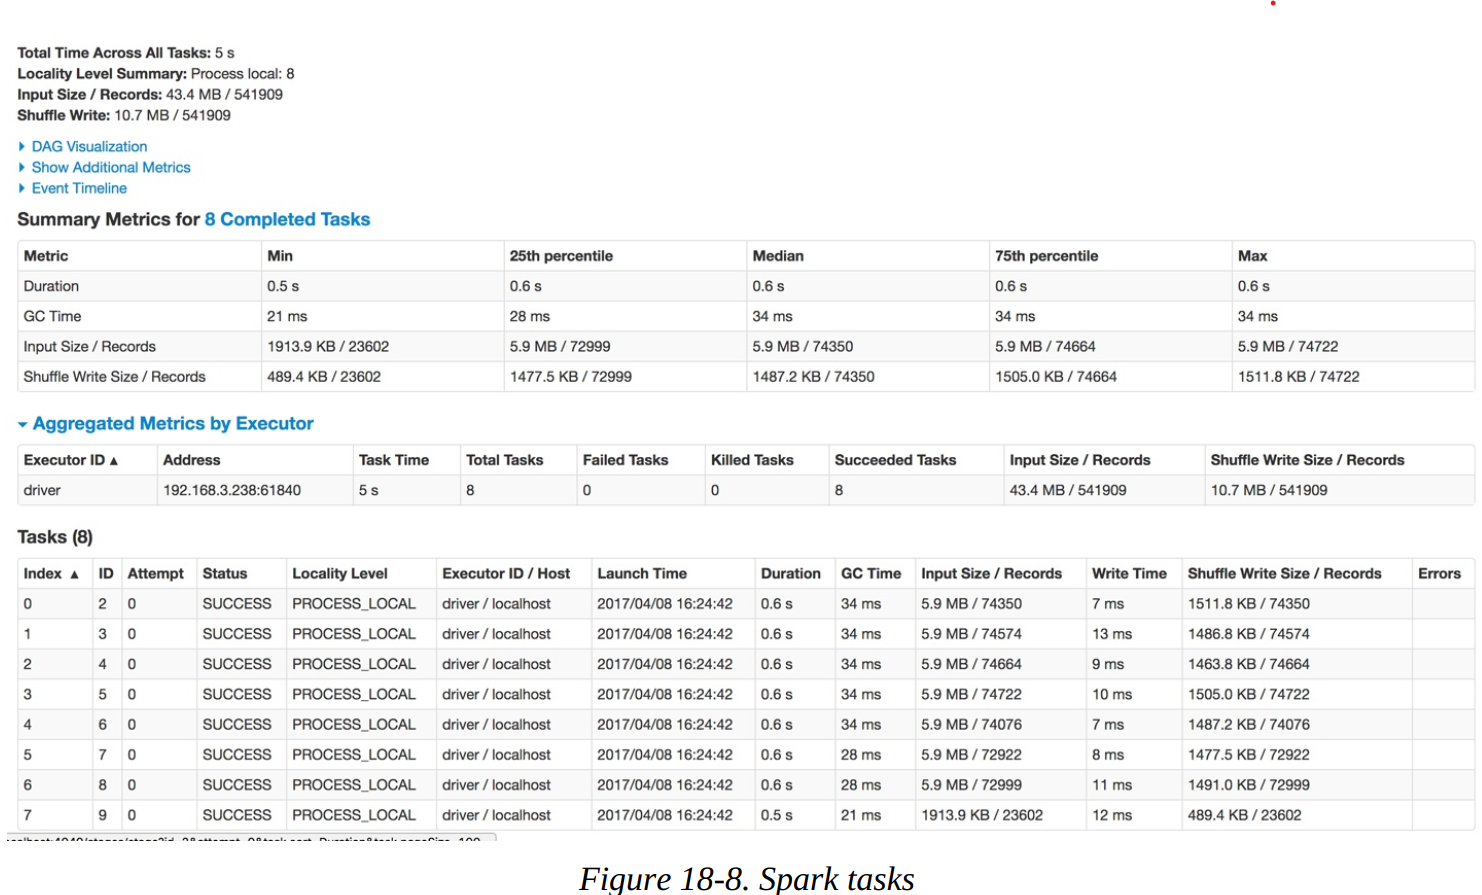
In this case, everything looks very consistent; there are no wide swings in the distribution of values. In the table at the bottom, we can also examine on a per-executor basis (one for every core on this particular machine, in this case). This can help identify whether a particular executor is struggling with its workload.
Other Spark UI tabs
The remaining Spark tabs, Storage, Environment, and Executors, are fairly self-explanatory. The Storage tab shows information about the cached RDDs/DataFrames on the cluster. This can help you see if certain data has been evicted from the cache over time. The Environment tab shows you information about the Runtime Environment, including information about Scala and Java as well as the various Spark Properties that you configured on your cluster.
What if I need to check history? Spark UI History Server
Normally, the Spark UI is only available while a SparkContext is running, so how can you get to it after your application crashes or ends? To do this, Spark includes a tool called the Spark History Server that allows you to reconstruct the Spark UI and REST API, provided that the application was configured to save an event log. You can find up-to-date information about how to use this tool in the Spark documentation.
To use the history server, you first need to configure your application to store event logs to a certain location. You can do this by by enabling spark.eventLog.enabled and the event log location with the configuration spark.eventLog.dir. Then, once you have stored the events, you can run the history server as a standalone application, and it will automatically reconstruct the web UI based on these logs. Some cluster managers and cloud services also configure logging automatically and run a history server by default. There are a number of other configurations for the history server. Refer to the relevant table on Spark History Server Configurations in the Spark documentation.
Conclusion – Your Spark Monitoring Guide
Mastering Spark isn’t just about writing perfect DataFrame code — it’s about knowing exactly what’s happening inside your cluster the moment something goes wrong (or slow).
Start every investigation in the Spark UI (port 4040 is your new homepage)
Use logs (driver + executor + event logs) as your forensic evidence
Watch the six critical areas: jobs → stages → tasks/executors → storage → shuffles → environment
Never again guess — the UI and logs will show you skew, spills, GC pauses, dead executors, or mis-configurations in seconds
Open the UI the second your job starts, keep the History Server running in production, and you’ll debug and tune faster than 99% of Spark users out there.
That’s it. One tab, one set of logs, zero excuses. Go monitor like a pro — your cluster (and your sleep) will thank you.